Video Transcript
0:27
you
0:32
now see people already starting to answer polls we appreciate it some of the questions we’re asking about
0:37
is is how you use your elbrick planting scripts do you use them can you get an
0:43
ROI and what is kind of holding you back from using variable rate planting more
0:51
I’ll give a little bit of discussion about this as people are cutting it in currently we have the predominance of
0:58
the people so far about 70% currently use variable like planting scripts but
1:03
there’s there’s still 30 to 40 that people say they don’t use very bright
1:08
planting scripts on there or their clients as growing operations
1:14
as we move on to the next question we asked who who is creating the variable
1:20
rate scripts a very high percentage third percent are personally creating them and then about about 50% use either
1:32
an opinion are independent agronomists and then a very significant portion also
1:38
about 30% say they use some type of a green tail so it’s a good mix between independent agronomists growers
1:45
personally creating them or a use of a greet ale and then we ask we’re asking
1:52
you know do you know that you make a positive ROI which is kind of the core of this our webinar today and about 60%
2:01
don’t know for a fact that they can show part of the positive ROI probably like why we’re on this webinar today a good
2:08
30% are fairly confident that they have a positive ROI and then there’s about 10 to 20% they just don’t know and then we
2:17
ask what is holding people back from using very ROI planting more very high
2:23
percentages are still having hardware challenges about 40% still say that hardware challenges are holding them
2:29
back 20% saying they just don’t have enough time to do it all and then
2:36
there’s there is about 30% saying available knowledge base is holding them back definitely you benefited the
2:43
webinars like today and then very at least half that people are saying the
2:49
ability to prove a positive ROI is holding them back and then kind of the
2:54
crux of the whole webinar today is if you could show a positive ROI would you would you use it more and a predominant
3:01
70% are saying yes and 25% are saying maybe and that’s that’s kind of what
3:09
we’re working on today is assembling people how understand how to do that I’ll let this poll go for a little bit
3:14
longer we still have probably 30% haven’t answered the poll yet so we’ll just keep
3:20
this going a little bit more I’m gonna explain zoo if you’ve never used them before just move your mouse around and
3:27
you’re probably gonna have a black bar either at the top of the bottom of your screen and as you move your mouse around
3:32
that’ll come up and that’ll tell you you’ll see then a Q&A button you’ll
3:38
probably see a chat button also so you let’s use the chat function if we’re
3:43
just making a general comment as we progress through this webinar you need a general statement like hey you need help
3:48
with something there’s also another section for the QA and if you have questions that you
3:55
specifically want the panelists to answer then type your questions in there and at the end of the webinar we will do
4:02
our absolute best to get through every one of those q and A’s that go into that QA section there and we’ll specifically
4:09
answer it that’s that’s very helpful for us and if you have questions as we go
4:15
through go ahead and type them in there we may not answer our way but we’ll hit it as we get to the end of the webinar
4:27
you so as we sent out the the calling for
4:33
this webinar today we said some topics that we’re going to cover at war how to set a variable rate plan to script for
4:39
your field what data layers should you use to set those planning scripts
4:45
how to get insights of you’re planing scripts and then we were going to show you some examples of ry+ planing scripts
4:54
and I am absolutely confident that Carlin Mike will be able to take us through that today and then we will
5:00
address those four questions as we move into the question and answer section so with that I’ll introduce myself again my
5:06
name is Scott Jackman from Devron I run US operations and wheels also the sales and marketing effort also with us today
5:14
is Mike Wilson and I’ll hand over to Mike Wilson for introduction of yourself
5:19
morning everyone Mike Wilson data collections lead for Devron UAS and agronomist with Veritas
5:27
work in the precision AG industry for almost 18 years now validating scripts
5:35
and creating success for customers has been a real passion of mine from the beginning working with the Veritas team
5:42
has brought us to new levels with the way we can analyze and statistic would
5:48
be analyzed the data to come up with some results and look for those successes something that I wasn’t able
5:55
to find elsewhere in industry at the time so wanna happy to work with Carla here today throughout this presentation
6:01
and answer any questions you may have to show kind of the steps we take to do that and help you guys learn more from
6:08
from the scripts you’re writing and make better decisions on the farm as we plant and get into this 2020 season yeah
6:18
thanks Mike and with that I’ll hand it over to Carla Carla Jackson is gonna lead us through the webinar today and
6:25
Karl if you would take over screen and I have stop sharing and the screen is now
6:30
yours Carla introduce yourself and let’s begin if we can okay great thanks Scott
6:36
can you guys see my screen okay can you hear me all right we can see your screen and hear you well thank you okay perfect
6:43
all right good morning and thank you everyone for taking the time to join us today I am Carla Jackson I am the market
6:52
development agronomist with Veritas here in Chatham in southwestern Ontario um
6:58
today we are going to be a Scott mention and and Mike I’ve mentioned we’re going
7:04
to be discussing variable rate planning prescriptions what you need to get started why validate them and some of
7:11
the return on investment and analysis that can be provided from the prescriptions when considering utilizing
7:20
any decision AG solutions there are four areas that you must look at that are important to ensure that the applied
7:27
methods are working for you the first one is to identify we want to identify
7:32
issues in your field whether it is nutrient deficiencies through soil sampling doing research plots or just
7:40
your knowledge of the field that certain areas are not growing the same as others once you’ve identified that issue what
7:47
do you want to do next you want to measure you want to measure those differences with imagery adjusting your
7:53
crop plans or creating management zones to help start tracking the differences so you can approve them effectively you
8:01
then want to manage those differences that you have measured by scouting those specific areas collecting and recording
8:08
the data for those areas and by writing prescriptions based on the management
8:13
zones that you have created you can start treating those areas individually with planning prescriptions fungicide or
8:19
fertilizer prescriptions finally you want to validate that you’re managing
8:25
those areas efficiently and effectively by putting check blocks or we call them
8:31
Vera blocks in your prescriptions regardless of what applying you can analyze the application you can also
8:38
create profitability maps that break down your efficiencies and your return on investment in each management zone
8:44
they can show you the areas that you need to increase or decrease seed input
8:50
costs etc to break-even by validating your inputs you can also start to
8:57
identify other areas that need adjusting and you can apply these four steps many
9:03
companies today offer one or two of these steps precision area companies can offer three of these steps
9:10
but as an industry we’ve done a poor job too at showing the validation so the
9:17
point of today is to show how to better validate your fields and learn from your prescription to make better decisions
9:23
moving forward today we’re going to
9:28
focus on using planning prescriptions and validating them to choose the optimal planning rate and also using
9:35
prescription insights to dive deeper into understanding our varieties and improving our deficient areas the most
9:45
popular question that many ask is how do I get started and or what data lay
9:51
layers do I need to get started you can work with your hieronymus to pull this data together or or to see what layers
9:58
you have or you don’t have to start collecting and how the data layers that
10:04
you need to start creating and using planning prescriptions is historic guilt or normalized yields you can use NDVI
10:12
imagery you can use soil zones ones that you have used in more recent years you
10:18
can use bare ground imagery you also need a digital boundary we’ll also need
10:25
the planter width and the combine width this information is used in the creation
10:30
of the check blocks so those are sure to fit to your equipment and it’s easier
10:36
for your monitor to follow we’ll also need the planner monitor and the tractor
10:42
does it have the ability to control the rate the make and model are also
10:47
important to ensure that the prescriptions are created in the proper format that works with your monitor if
10:53
you have if you just need basic shape files and we send you a task controller
10:59
file those aren’t going to communicate so we want to make sure that you have the right format for your prescription
11:05
right off the bat so they can start working together quick and easy we’ll
11:10
also need the a B lines so the tractor guidance so we can make sure that the script is lined up with your tractor
11:16
guidance so where your where you they’re planning is where your prescription will start once you’ve
11:25
verified that you have some or all of the required layers then we can start to make the planning prescription Fairbury
11:33
prescriptions can be based on yields at least three to four years is preferred but one year can be used for growers
11:40
just starting out we then can create three or four crop production zones created based on your yield performance
11:47
and other characterizing features like low yield the medium to low yield the
11:53
medium to high yield and the high yield prescriptions can also be created off
11:58
bare ground imagery soul zones or NDVI crop health imagery sometimes all are
12:04
used you can see on this map the larger one here the zones are based off a
12:10
normalized yield at the top right the zones are created off a one-year yield and the bottom right is a satellite
12:17
imagery and you can tell that the soil color and the type is quite indicative
12:23
of its impact on the yield those zones all line up fairly well once you choose
12:30
the most representative image a prescription can then be created when making a script your seeding rates
12:36
should be discussed with your agronomist once you have decided your rates based on your fields variability and variety
12:43
they’re assigned to corresponding production zones for instance if you’re planting corn you’ll want to put your
12:50
higher seeding rates in the high yielding zones and for soybeans or edible beans you’ll want to put your
12:56
high seeding rates in the low yielding zones this is to increase the yield and
13:01
those low areas but also to control the white mold risk and those high yielding zones the lower population if it was
13:09
more plant space equals less disease risk this field for example has a huge
13:16
variability and that’s why there’s a large spread in the seeding rates of 28 to 38 thousand if your field doesn’t
13:23
have a large amount of variability your range and raids can be tighter it could be 32 34 36 32 36
13:32
32 to 38 depending on your soil type and your variability these are also the
13:39
standard rates to start out with when trying planting scrape scripts knowing the different areas of the field
13:46
and the varieties you’re using is very important you can also work with your local seed rep to get the optimal seed
13:54
rates of the varieties that you’re planting and also to find out the varietal response from variable rate to
14:00
help you get started once the rates have been assigned ver blocks or check blocks
14:07
of higher and lower seeding rates are added to each yield zone for validation after harvest this process is a very
14:14
very important to validate and learn about optimizing your seeding rates to
14:21
improve the efficiency I also just wanted to note that it’s also possible
14:26
to add ver box to any scripts so if you want to create your own script that is
14:32
great like you can create your own zones you can apply your seed units that you want to follow we can then add the check
14:39
blocks to your script and then for the final prescriptions so you can send any
14:45
in any prescription and then we can just add in those the variable ox for the analysis at the end of the season fare
14:56
box or checkbox allow for plot research on the on the field scale check box do
15:03
not require extra work for the grower especially in the busy season the monitor does all the work this allows
15:09
for the farmer to plan the field in one pass to combine and harvest in one pass
15:14
there’s no way weighing and required or extra work you get tons of data and analysis to learn from it takes a little
15:22
extra work in the in the winter for planning but that helps you to ensure
15:27
that there’s less work when it’s in the busy season bear walks can also provide
15:35
insights to what the ideal target rate for each yield zone is your return on investment and also a variety comparison
15:43
within the field which variety performs best in each production zone and what rate is
15:48
optimal here are two examples of plenty
15:55
of prescriptions with fare blocks on the left is a corn script where you can see
16:00
that the high production zones and rates are within the fields and the low production and rates are typically head
16:06
lands on the top of the nulls this grower planted 31 to 38 per acre so
16:13
they have four production zones a low and high outlier seeding rate is added
16:19
so you can compare the lowest actual seeding rate to array above and below and same for the highest actual seeding
16:26
rate this is so at the end of the season you can compare what rate perform the best and maybe they need to decrease the
16:34
rates or up them on the right is a soybean script the highest production
16:41
zones are the slowest seeding rates within the field and the higher seeding rates are on the headlands and nulls
16:49
this field has a bit of variability in the rates range from 145 to 205 with two
16:58
outliers seeding check blocks you can see that the grid pattern that’s
17:04
overlaid on the field is set to the equipment size and then we put in the different check blocks in each
17:10
production zone this orange zone here it’s the 31,000 seeding rate and you can
17:17
tell see that there are six red blocks which is the 29,000 seeding rate and
17:23
there are six yellow blocks of the 33,000 seeding rate all on that same zone so this forces the equipment to go
17:30
higher and lower so you can actually analyze what the optimum rate was for this production zone
17:38
we also use your a B lines or your guidance lines you put towards the
17:43
straightest side of the field so we can make sure that the script is actually lined up with the areas that with the
17:49
area that you’re going to start planning first you can see that in both examples here I can I will now go through a
18:01
couple examples of how the process works start to finish the planning
18:06
prescription was created based on yield and this script is for soybeans so these
18:11
sign rates as discussed with the grower are placed in the appropriate zones the
18:18
very box are then placed randomly throughout each production zone so you can see that the lowest seeding rate a
18:24
large check block of 135 was placed throughout the 145 production zone once
18:31
the script is reviewed and approved the grower will get a PDF copy so they know
18:37
the total amount of product needed and their target rates the appropriate format for the script is then exported
18:43
and loaded to the growers monitor when you’re planning please ensure that the
18:49
right fields prescription is activated and on and then let the monitor and the rate controller do all the work the
18:59
middle map is what the planning as applied map looks like you can see where the planner increased and decrease the
19:05
rates throughout the fields the yield map on the right shows a high yielding
19:12
areas corresponding with the lower rates we know the zones are correct but the
19:19
rates need some adjusting these three layers the prescription the as applied
19:25
and the harvest maps are used in the end of season analysis
19:33
the value of having check blocks is being able to see what you plan it and a profit made the check blocks compare and
19:41
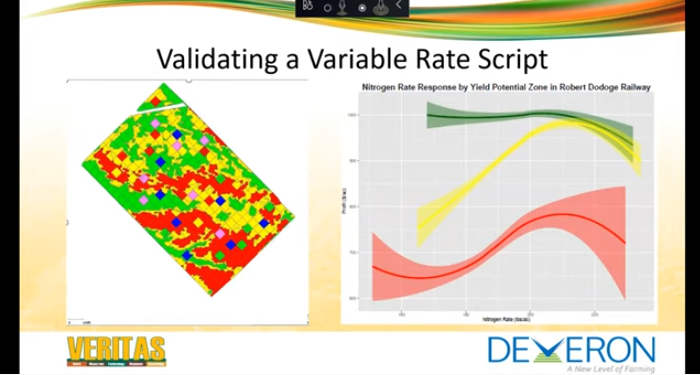
show you if you planted a higher or lower seeding rate and what would your ROI be so when we look at these graphs
19:55
here on the page we I would say this is a very good set an example to use for
20:01
what you would see likely in your first or second year of trying some various eating prescriptions as Karla mentioned
20:09
how we set the rates up and and how we filled the prescriptions is key to being able to produce curves like this and to
20:15
be able to do this statistical analysis to give us enough data on what the results begin to look like so the graph
20:22
in the top left is a typical response we see from a corn hybrid and the graph we
20:29
have in the bottom right is what we see kind of in the first year approach with a soybean customer so generally we see
20:37
here the three or four different production zones labeled by color so the
20:42
in the top left graph the red line is the low producing areas of the field
20:49
obviously profit per acre on the Left axis shows us that the mid-range is our
20:57
medium or average producing areas and that’s the yellow color and our high producing yield areas our most
21:02
profitable areas in the field are represented by the green curve the solid line in the middle of the curves
21:08
represents the average of the data or the line of best fit the shaded area or
21:15
the light green or yellow or red areas represents the spread in the data or
21:21
some like to say the confidence interval in the data so the wider the spread the thicker the line the more variability we
21:28
have either due to zones or due to fried your performance or whatever have you if it’s a little bit of noise in the data
21:34
and the less predictable the the end result would be of the lines but nonetheless when we look at these two
21:40
graphs we start to see some really interesting trends that make sense economically and really help the
21:45
customer and the agronomist makes smarter decisions moving forward on this farm the hashed mine or dashed line that
21:52
goes vertically is the average rate of the planning script or let’s say the
21:58
average seeding rate the customer would have planted had he done a straight rate application in the field so right away
22:04
you can see in the red area on that on that corn graph if you would have planted the thirty four thousand seeds
22:11
breaker that is the profit breaker you would have made by planning less seed he was actually more profitable and by the
22:18
looks of that curve could have been even more profitable had he planted less yet when we look at the yellow line he’s
22:25
fairly close to the top of that curve and that makes sense ager anomaly I mean the historic average
22:30
seeding rate for your average field numbers should be pretty close to that most profitable area in the average of
22:37
that field and it is showing that that is accurate pretty accurate on that farm when we go into our high-yield zone the
22:44
green lining we can see where we would have been at the average seeding rate and as we move to a higher population
22:52
profitability goes up this script did make the customer some money in the zone but there’s potential to increase
22:58
seeding rate farther for even more profit so we learned two things you know
23:03
or at least two things from this information we learned that yes the script was profitable yes the customer made the right decision and that variety
23:09
did respond and we also learned that there’s potential to maybe push this a little bit farther as we move into three
23:16
years if that is shows the same trend over time when we look at the soybean map in the bottom right corner we have
23:23
the same scenario in the same way of reading the curves but we get a little different aspect on on the end result
23:29
and the seeding rate that was chosen in the field so again if we look at that horizontal or the vertical dashed line
23:35
we see our average seeding rate in that field would have been about a hundred and seventy five thousand seats breaker
23:46
when we look at the curves themselves also we see the blue line being our lowest yielding areas with our highest
23:54
seeding rate it’s the opposite of corn in order to try to promote
24:00
more vegetation more seats breaker stronger crop growth so on and so forth
24:07
and then on the other end of the spectrum the red line being our highest yield environment most profitable area
24:12
where we apply the lowest seeding rate because we get naturally good growth we get excellent germination risk of
24:19
disease is higher so on and so forth so when we start to analyze the other set of curves we can see that the blue line
24:27
is actually most profitable right at that 175,000 seeds breaker that the
24:34
customer planted as is average and if we think about that in the real world why do our customers plant 175,000 seeds
24:40
breaker in a field it’s usually because we want to ensure that that 5 acres in
24:45
the back corner that’s usually tough and in under poor conditions just won’t come up or won’t perform if we don’t plant
24:52
that many seeds so we wind up sacrificing the profitability across the rest of the farm based on the worst
24:58
areas of the field so when we look at this graph we can see we should have planted 175,000 in that poor yield
25:05
environment we should have planted less than that and the green yeah as we move
25:11
to the left we get more profitable the yellow is showing the same trend it made
25:16
us money from the average but we should have planted less again and the red line showing the exact same trend also so the
25:23
what we see on this is yes the script made the customer money but at the end of the day having planted twenty five
25:29
thousand seeds break or less still in a variable rate situation would have made him even more and had made him more
25:36
profitable
25:45
so this is a paper report we can give back to the customer at the end of the
25:50
season we do supply that graph that we just reviewed this is the actual soybean field that we were discussing in that
25:57
graph but we also give where the profit was actually made in the field in the in
26:02
the map in that top left corner and how each zone performed profitably and we
26:08
also give some statistic numbers at the bottom so that script itself made the customer seven dollars and 33 cents
26:14
compared to what the data is telling us he would have made had he planted that straight rate 175,000 seeds breaker so
26:22
the total profit of that field was about four hundred and fifteen dollars over planning it straight rate and that’s
26:29
allowing and that’s by doing nothing different other than doing a little bit of work and setting yourself up ahead of time and planning the monitor the
26:36
potential in this field was for just over seventeen dollars an acre profit had we had our crystal ball and were
26:42
able to hit the perfect population you know for that growing season with the weather we had the block the graphs are
26:50
on the bottom right show what the ideal target rates were and the variable rate
26:55
potential revenue that we could have made so when we think about that set of graphs that we just want reviewed you
27:03
can see here that the data is telling us that four zones probably weren’t ideal
27:08
three zones would have been enough and that we are correct that 150,000 seed
27:14
breaker average seeding rate you know reducing each of those zones down by twenty five thousand seats breaker would
27:21
have made us more money and would have made us more profitable at at the end of the season both agronomically and and so
27:34
when we look at this farm customer across his entire operation 1,100 acres
27:40
were done with seeding scripts in this year seven dollars and 27 cents was the
27:48
average of the each in every field with an eight thousand dollar net profit to
27:54
the customers bottom line by literally doing nothing different in with his in field operations it takes
28:02
a little bit extra time now to get your script set up put it in your monitors created properly and then we get you
28:11
know to the field we plant like we’ve always done from one side to the other there’s no adjusting equipment there’s
28:16
no changing seeding rates in your within the monitor it’s just plant and finish
28:22
move on to the next one follow it up with the combine at the end of the season harvest as always and then
28:28
submit the data for analysis it’s a real quick and easy way to get some real good analysis and some real good results
28:34
without a lot of time taken in the field and you can see by this set of
28:40
information that it’s we don’t always get it right either our scripts are wrong based on variety performance or
28:47
the zones aren’t quite accurate enough and we need to do a little bit more digging in certain fields you know
28:53
whatever the reason is you can see that you know in this case there’s 1 2 3 4 5 6 7 8 9 10 or 11 negatives there but at
29:00
the end of the day the average is positive and it does show a fairly decent return into the faroe great scrap
29:06
process thanks Mike and here is another
29:16
example of the planning script to harvest for an edible bean field this
29:22
field zones are created based on normalized yields this customer also created these zones for soil sampling
29:28
and now they’re using the same zones for planting and their fungicide applications barrel rate planning and
29:35
fungicide applications you can see from the script to the planting as applied
29:42
the grower hit the targets pretty well and then when you look at the harvest map on the right how close the yield
29:48
zones correlate with the zones created from the normalized yield the prescription is started starting to even
29:55
at the yield in the middle productivity zones and the head lands are still the lowest yielding zone these results are
30:05
from 2019 and based on the season we had around here what spring Jody summer the
30:11
planning it could have been reduced to attained a heart higher ROI yeah that’s great Carla
30:20
as you can see by this graph you know the first and most obvious thing that jumps off the page to us here is we
30:27
should have planted less than every zone the trend is up and to the left meaning more profitable at the lower seeding
30:34
rates now 2019 was in a unique year and maybe we don’t want to put all our eggs
30:39
in one basket and take this approach across the entire operation next year but it is a good case of learning and a
30:46
good thing to see if we see the trend repeat we have done lots of work in edible beans over the last five to ten
30:52
years and we do see the trend of reducing seeding cost being more profitable but the trick is now to
30:58
identify what is the optimum seeding rate in those zones in your field and how do we get to do that and then make
31:05
sure we are hitting the so you can see here this customers average seeding rate
31:11
was about 102 to 103 thousand seats breaker you can see the two higher
31:16
yielding earth sorry two lower yielding areas with the higher seeding rates actually cost a little bit of money in
31:22
this script the red line definitely was a loss the script heard him he would have been better planning at that lower
31:28
seeding rate the yellow line also was a
31:34
bit of a loss not much luckily those two areas in the field were small and and
31:40
because the most of the field was in the higher yielding area the script was still profitable but you can see how the
31:47
green line made money and could have made a little bit more had he gotten further left and the blue line
31:52
definitely made some money and arguably he’s probably getting close to that low-end number you can see how the
31:59
bottom of that curve starts to dip down a little bit in the shaded area so we’re getting close to finding out where that
32:05
optimum level is there’s what we need to start being careful and watch that as your start to come here are the results
32:14
again that with the deliverable to the customer at the end as I said most of the zones in this field where the the
32:21
green and the light yellow the high yield environment as you can see by the map there and so that made the script quite
32:27
profitable and he was able to make thirty four dollars an acre with this very great edible bean seeding script
32:34
animal beans do respond very well the very populations and we can see we see
32:40
great results as we move forward again if we look at that map on the bottom
32:47
right with the ideal target rate that shows us the where the top of each curve
32:56
was and and what rate would have brought the most profit based on the information
33:01
on the graph so to calculate that ideal target rate we look at those curves that
33:08
we see in the graph on the top and we see where the line is highest what the seating area would have been to bring
33:14
the most return to the customer in each zone and we extrapolate that out across the original prescription zones to give a
33:22
map showing what the ideal seating rate would have been based on the information
33:27
received from from the analysis so when
33:34
we look at a typical analysis of the full or fields that a customer did with
33:41
edible beans in in this past growing season again we can see the average profit across the firm from from the
33:49
seeding scripts that were created in this past season we have roughly three
33:56
wins one loss you can see the analysis there on the bottom the 288 acres with
34:02
the 618 average profit with just under eighteen hundred dollars net profit of the customer doing you know using the
34:10
data to his advantage and using some information to make some better
34:15
decisions moving into the 2020 season
34:22
thanks Mike and to go along with those optimal target rates and the best ROI
34:29
other very fair block insights can look at the different varieties in the fields
34:34
this is an example from a seed company where they’re trying to find how each of their varieties perform in
34:41
different production zones which variety yielded the best but also looking at the
34:47
optimal seating rate of each one first graph is a box plot of how the varieties
34:53
yielded by productions on the bottom table breaks down each variety and how
34:59
it yielded in each zone and what the optimal rate was bearer box can also tell you what the yield was of the
35:05
optimal population for that year because it was tested there are many more
35:12
examples of insights that checkbox can provide but these are just some of the more popular examples for planting
35:19
validation and hopefully we’ll have another webinar that just goes a little
35:24
more in depth on the on the analysis piece in the future here so remember the
35:34
four steps from the beginning identify the problem and use existing technology
35:40
to improve it measure the differences if you can’t measure it you can’t improve it we have the ability to measure every
35:48
pass of the fields manage and validate your applications feel specific data
35:55
appeared with strong analytics provides the Sola answers and a proof we need to
36:00
remove some of that emotion prescriptions with check blocks help verify the applications ROI and to
36:07
determine the appropriate rate prescriptions can also help organizations and growers be more for
36:13
our compliant so talking to your agronomist today to see what data you
36:19
need to start collecting you can provide measurable measurable results to your firm thank you and we’ll open up for
36:27
questions hey Carla thank you and Carla actually if you could just keep
36:33
presenting and then I will ask you to jump to specific slides if we get there I’m gonna work through the Q&A session
36:41
here as you guys listen to Carla and Mike talk through we said we’re gonna
36:47
talk about how to set a planning script for your field we talked about the data layers that we use
36:53
and that we recommend that you use if you have your own methods for setting those plenty of scripts then we talked
36:58
about how several ways to get planning script are Oh eyes I’m sorry get
37:05
insights into your plainer scripts and then we talked about some ry+ and actually had a couple negative in there you know it doesn’t always work
37:10
and mother nature is sometimes fickle so we do our best to minimize that we’ve
37:19
got several questions and we’re gonna go through them right now I’ve got three questions in the chat section and I’m
37:24
gonna clear the questions in the chat section first and if you have questions going forward if you could try to get
37:30
them in the Q&A session that will absolutely get over there work through those so Mike and Carla you just
37:37
determine who’s gonna answer these first question is in the chat section do we
37:43
think that the yield map has good accuracy for building our variable rate
37:48
planting scripts again how do we do we think the yield map is it has good
37:54
enough accuracy to build a planning script for next year yeah sure that is a
38:02
yes and no as the answer to that question and I would say that depends on the yield map that you or the or animist
38:12
has chosen to use you’ll get a Ken skew information and provide false things at
38:22
times so you know the more knowledge we have of the field the more information
38:28
we have telling us the stability of a zone the better we have yield is the most
38:35
important data layer and making that decision but it doesn’t always need to
38:41
be the only one when we start using multiple years worth of yield we start to see the trends really unearth
38:47
themselves when we start adding in elevation soil type and some other types
38:53
of zone layers like that then it really becomes clear and we give it a very inaccurate decision crops like soybeans
38:59
where you’re high yielding areas that have get affected by disease like white mold or something that can be
39:05
detrimental to or is a perfect example of how even that it can be skewed and and maybe make the
39:11
results not quite accurate when I’m looking forward but knowing that and
39:17
using some corn yield maps and some elevation data and some other things like that really help to clear those
39:22
issues up so one year’s worth of yield if it’s the right yield and the customer
39:28
agrees with it and the agronomist understands that it did have everything going for it can be used but ultimately
39:35
yes be careful and two or three more the more years worth the better obviously
39:40
that’s where we get normalized you’ll map like this showing us the trends over time and the ability to start making
39:46
predictions on how that fields going to perform thanks Mike
39:52
I’ve got two more questions on the chat section and they they generally all deal with setting that yield rate so I’m
39:59
going to ask both of these questions and then Mike and Carl if you could broadly talk about your response here kind of
40:05
incorporate your answers to both of these the next question is well the next
40:10
two questions are how do you set the ideal rate so how like how do you get
40:18
that number from your recommendations and then right in line with that is how
40:23
do you determine the range of those zones so for example the map you have up
40:29
here you have a seeding rate of twenty thousand thirty one thousand thirty-four thousand thirty eight thousand what
40:35
methods did you – did you guys use – number one set that rate and number two what a recommendations are for creating
40:43
the variation in zone at very rate variation in rates sure
40:49
so that is determined usually by specific knowledge within the area if we
40:56
have seen representatives that know how the varieties perform and population
41:03
range it typically performs best in that’s very very useful information out of the gate if we’re in working with a
41:11
new customer that does not have a lot of data or is unsure usually we use their
41:16
average seeding rate as a place to start because that’s usually what’s worked best for them in the past and then we
41:22
can go up and down from there and we use the data learned from the analysis to
41:27
tweak educate ourselves and the grower and and build stronger decisions as we
41:35
move forward how do we know how far the spread should be in a seeding script
41:42
basically comes with you know the experience of the ground and looking at
41:47
the amount of variability present within the field if your yield monitor is consistently only swinging you know a
41:54
very small percentage from one side of the field to the other then there isn’t the need to put four or more zones in
42:01
that field and there isn’t the need to put you know four or five different seeding rates in that field if the
42:08
fields fairly flat and even then two or three seeding rates is is probably ideal but if you get a field like this one on
42:15
the screen where you’ve got yield swings from a hundred to three hundred bushels per acre of corn and you know there’s
42:20
anything everything from crated clay to gravel across the firm then yes you know
42:27
experimenting with that seed and pushing the envelope a little bit really does
42:33
begin to pay and really does show some some advantages out of the end so it’s a
42:39
little bit of learning curve in year one and two but once you start to understand the process and and how the populations
42:46
can affect the end yield then you can start to hone in and make better decisions across the entire operation
42:53
and other operations within the same area now thanks Mike we have now moving
43:01
over to the QA session we have at least seven more questions here we’ve got about 15 more minutes on the webinar so
43:06
we’re going to do our absolute best to get through all these questions if you have more questions by all means put
43:12
them in there and if we can’t get you in the remaining 15 minutes we’ll send you an email response on our our answers for
43:18
that so the first question in the Q&A section is this this individual has seen
43:24
research that indicates that with soybeans and wheat that 20 to 25%
43:30
seeding rate variation is required to see significant yield changes what
43:35
are your thoughts about that you are you saying do you are you seeing that also as you said the rates yeah I think
43:44
that’s I mean I wouldn’t disagree with that at all I think that will tend to change based
43:50
on the different areas of the world that the prescriptions are planted in Carla if you go to the soybean script there
44:00
you’ll see that you know if we look at the minimum seeding rate there of a hundred and forty five thousand seeds
44:07
per acre if we add forty percent to that number I think it comes out to about two hundred
44:12
and three thousand so you know in that script there we’re actually changing seeding rate by 40% so yeah I think I
44:20
don’t think you need to do 20% with every jump but I think you want to
44:26
probably see you know a decent change in an overall seeding rate to see a
44:31
response from from one side of the field to the other and again the amount that we push that rate change and the number
44:40
of rate changes or zones in a field defi definitely needs to depend on you know
44:45
the variability that you’re seeing in that field and and if ultimately if you’re seeing a response from from that
44:52
from the change itself now thanks Mike
44:58
the next question is a little bit longer but if try to bear with me as I as I asked it and then simply address the
45:04
question is in soybeans the low yielding areas are likely to be in those areas of
45:10
poor soil quality so so therefore the questionnaire says you probably should
45:16
plant a higher density of plants in those areas and so now give the crux of the question how are those plants in
45:22
terms how are those plants in terms of similarity across the rest of the field
45:29
affecting you know so is the issue normally poor soil masques higher
45:34
seeding rate or what are your thoughts about that well very good question and
45:42
yes that is something that we look at and try to watch and I think that is the main
45:49
reason for continuing this process on as we go and learn and as we try to fix and
45:54
change fields so you hit the nail right on the head it is those poor soil quality areas that
46:02
do require the higher seeding rates to one get proper emergence two to promote
46:11
growth and in some competition there in the road to get the beam to grow taller faster shade the ground sooner to help
46:18
combat weed pressures so on and so forth just typically those lower areas don’t
46:24
promote a thick vegetative crop in soybeans or edible beans so increasing populations helps us with that and helps
46:31
to get more pods or acre in general and as you say vice versa that low rich high
46:39
yielding ground is naturally very vegetative the crop grows rank and
46:45
healthy higher populations usually cause lodging increase in disease and things
46:51
like that so that’s where the variable population can help with disease pressure in those areas and help with
46:58
you know weed weed management we pressures in the lower lower yielding areas so you know as we begin to work on
47:07
a field holistically and we start improving soil quality and those who are performing areas if we can if it’s
47:13
something we can manage sometimes it’s not then you know the scripts may potentially change over time as we begin
47:20
to increase yield in those areas then we can start ratcheting back seeding rate and and start making adjustment as far
47:26
as crop quality and things like that go and staging really haven’t seen a big
47:31
difference on you know harvest ability or staging differences in the crop
47:37
usually those tougher areas are the ones that die down or mature faster anyways
47:43
so a thicker feeding rate isn’t usually an issue if anything we see probably
47:48
better harvest ability by reducing the seeding rate in the better areas to
47:54
reduce lodging and reduce the amount of disease making quality go up
48:00
and in the harvest ability easier and better so definitely a great question
48:07
and there’s a lot going on in that question and a lot of other things to measure seeding rate alone is not gonna
48:12
fix the problem it’s more of a way to manage the current problem and and work through it to identify some other
48:18
economic issues that you want to focus on on the firm and tackle to get things
48:23
moving along better it’s so thanks Mike leading right into that then management
48:31
a lot of variabilities how do we if if we combine a variable rate seeding along
48:37
with fertilizer along with fungicide scripts in one field how do we how do we how do we isolate the response for we
48:44
are seeding yeah great question and something that we’re working at to do of
48:50
you know the multi variance analysis and things like that across across different scripts and the short answer is very
48:57
difficult so when we’re talking about very fertilizers and things like that we
49:05
recommend that the customer use the same or very very similar zones to that of
49:11
the planning script and begin the fertilize you know based on soil levels and crop removal levels across the field
49:17
so that most of the entire zone being treated is treated with a very similar
49:24
rate of fertilizer fertilizer itself I know is pretty much proven you know we know crop removal rates we know how we
49:31
need to build the soil so on and so forth we don’t typically do blocks on large-scale fertilizer like P and K and
49:37
things like that we can it just so it was a difficult thing to build and it takes time you
49:46
know five to ten years to fix major issues depending on on how bad they are so you know a block in one year might
49:53
show you something but ultimately not not everything but when we start looking
50:00
at that fungicide nitrogen seeding scripts and things like that then yes a
50:06
small field with lots of zones like some of these we’ve shown it becomes very difficult and our recommendation would
50:12
be just do one thing time learn what works one field at a time and once you’ve proven it to
50:17
yourself and know the response then you can start doubling and and adding multiple approaches to a single field if
50:23
you’re lucky enough to have large acres 100 acre fields plus where the
50:28
variability is large enough that you can put enough blocks in to do two different treatments at the same time then
50:34
wonderful I mean those are fun fields to work with and we enjoy that but we need to make sure that we do not overlap a
50:41
fungicide script block with a seeding script block and we’re able to dissect
50:48
the data at the end of the season properly so that we can analyze both script individually and give you the
50:54
results in total but that is a field by field specific situation and needs to be
51:01
treated that I had a one on one level of that but great question yes you know when we start to manage multiple things
51:07
at a time it can get cloudy if the proper steps are taken
51:14
yeah thanks Mike so right in line with that you may have already answered that but this question is is these these
51:21
examples that you used here were these isolated examples or was there other
51:27
variables one in there and they specifically asked was a very bright fertilizer scripts on these fields that we use an examples or were these
51:34
isolated fields so the field on the screen now know there has not been
51:39
varying fertilizer done with this customer yet although he is seeing enough variability that that is his next
51:45
step and he’s working towards that very quickly because he’s identified there is a lot of variability on the firm’s and he
51:51
wants us are managing it differently the error will be the first edible bean example we showed this field here this
52:00
customer has been doing actually began and started with soil sampling and has
52:06
variable rated the fertilizer on this farm for many years probably 10 plus and
52:13
these zones that we use for this planning script are actually the same soil soil zones that they created you
52:20
know with their agronomist using normalize yield and they’re the same zones that they use for der berating the
52:27
fertile so lots of data with this customer lots of information going on the firm’s and
52:32
you can see here by the stability of the zones you’re in you’re out and the way the field behaves that but they’re
52:38
getting it dialed in very well and you know the results are quite positive for
52:43
this operation yeah next question can
52:51
can this technology can this methodology or way of thinking work on silage can we
52:56
verify corn silage without a yield
53:02
monitor it becomes very difficult that’s the piece we use to you know do the
53:10
ultimate validation and then get us the hard numbers to to prove success or not at the end of the year but I’m not gonna
53:17
say it’s impossible if you’re a customer that has a harvest lab or some sort of a
53:24
yield monitor system on the silage machine that becomes a little bit easier
53:29
I mean we’re now starting to get some yield data and it’s potential that we could we could have some success there
53:35
but without that hard number it’s it is a challenge I mean the concept would
53:40
work absolutely there’s no reason why silage wouldn’t benefit from it as well but to get that ROI it becomes difficult
53:47
there is potential to possibly use an end DVI image and extrapolate some yield
53:54
values out especially if there’s a part of the field left that is combined that we can do to validate and I guess
54:04
correlate the NDVI image back to a yield and you could extrapolate but like I
54:10
said it becomes very difficult and I would say yield is is probably necessary
54:15
to guarantee good results out of the gate
54:24
thanks Mike how do we determine the
54:30
number of check blocks we use so our
54:36
rule of thumb is the more the better without sacrificing the integrity of the script we like to try to get at least
54:43
five blocks of each seeding rate higher and lower in each zone sometimes the
54:51
fields just don’t allow it I mean the picture carla has here on the on screen now is perfect I mean you can see we
54:57
definitely have more than five red and yellow seeding blocks in that orange
55:02
zone for sure in that field you know we’re gonna get some lots of data lots of stability but when we started to get
55:09
into those green headlands area I think there’s still four or five you know but it gets tougher to put the blocks in and
55:17
get some that out of it so and then if you look at that field to the north it’s such a small field it’s hard to get a
55:23
lot of a lot of data out of it so depending you know equipment size
55:29
changes how big our blocks are obviously and the amount of variability within a
55:34
field and field size are all things that that start to determine that but for you
55:40
know good statistical analysis we want as many data points as possible and we want to try to get as many blocks
55:47
in as possible without you know without ruining the script and without creating something that the planter can’t
55:52
physically plant ie rate changes happening so fast that the controller and the monitor can’t can’t adjust fast
55:59
enough and and then creating frustration for the for the customer and the operator in the field that’s one thing I
56:05
want to add to that to Mike is that we can adjust the blocks to like there is a difference in hitting your target rates
56:11
with hydraulic and electric drives so we can adjust the blocks to make them a
56:17
little longer to allow for that adjustment just so you have a better opportunity to hit those target reads so
56:23
we can work with the grower to adjust the blocks to work with their their equipment too so so right in line with
56:30
that then the next question is is how do we validate the planting the planting
56:36
rates are we validating in using the as-applied a later or or do we
56:41
ask the that they are their grandmas ground truth what planet or combination of both yes yeah I mean a ground truth
56:51
is always wonderful it’s not needed for the analysis we do but I think it’s a great great step for the agronomist to
56:58
do with the grower to ensure satisfaction of the script and unfettered understand the field
57:04
conditions and make sure they are seeing what they expected across the field but
57:09
to do the analysis yes is that as applied data compared to the yield map
57:14
at the end of the year that’s allowing us to do the analysis we want the as-applied data so that we can see
57:20
exactly what happened in the field with the planter was description off its
57:25
places was there some straight strips done from one end of the field to the other did the season did they plant
57:32
earlier did they plant late and that they use the script multiplier in the cab and bump seeding rates up or down you know whatever potentially has the
57:40
ability to change in season we want measures so that as applied map gives us that detail and allows us to dissect
57:46
what’s happening it also allows us to see more data points in the field as
57:52
that planter ramps up and ramps down it actually begins to give us you know other seeding rates and other things to
57:59
look at and see how the yield performed you know when we dissect it really
58:05
intense level yeah and then and then right in line with that is if we have a
58:11
late planting season so we got we did all the work over the winter and then we have a late season are we able to adjust
58:18
those scripts and those planting rates with the ground mr. rower yes absolutely you know we prefer that the grower and
58:25
the ground must work with us and tell us the way that our analysis tool works I
58:31
mean the analysis will work and you will get results back beautifully but when we
58:37
look at those vertical lines we were showing on the graph Colonel if you can go to one of those examples
58:42
I’d say the soybean chart or soybean graph
58:49
so you know if we’re looking for the average seating rate to be 175,000 and
58:54
we have those target rate dots on the of the page of each individual target obviously if you use the script
59:01
multiplier in the cab that changes the results and the way the computer does the analysis at the end of the season
59:07
will will will throw it off and give some skewed numbers so knowing how you
59:13
change that the script and whether you increased or decreased it allows us to tweak that before we do the analysis to
59:20
give you the most accurate results nonetheless you will still get a set of curves and you will still see the trends
59:25
and you know it will still give you some answers but yeah but yes you definitely
59:31
can be changed and modified as the season changes that’s a very important yeah great and we’ve we’ve still got
59:38
three questions and we’re gonna do our best to get through these I hopefully we don’t get kicked off here next question is do we have any data for best
59:47
management practices for other crops such as canola’s or cereals have we
59:53
applied this methodology to things other than you know beans and corn a little
1:00:00
bit yes corn soybeans and edible beans are the major three we’ve done that’s where most of our data lies today we’d
1:00:07
love to start working in the other crops to build a database and help other customers learn the process would be
1:00:13
identical in wheat and cereals you know we tend to see the similar trend where
1:00:19
you want to increase seeding rates in those poor who are growing environments
1:00:25
typically because you know we want to promote tillering and promote more heads per acre and those low over you know
1:00:33
those that lower unproductive soils and then obviously in that really high
1:00:38
producing areas where we get tons of tillering naturally lots of heads breaker you know I think that’s the oh
1:00:45
that’s the areas where we want to you know look at potentially decreasing seeding rates and then you know
1:00:50
ultimately the Knights of your management program on top of that becomes critical to ensure that we are
1:00:55
feeding the crop properly and timely and to promote that tillering and get the
1:01:01
get the proper amount of plants and heads breaker we need we’ve done a small amount of work in the cereal market and
1:01:07
and you know those are the trends we’re starting to see out of the gate the canola piece and some of those other
1:01:12
crops we have not as of yet but definitely would be interested in working with customers on that and and
1:01:18
then learning and identifying the key factors as we move out next question is
1:01:26
uh is the profit numbers that we showed so the examples that we showed and then we had a profit number in there do those
1:01:33
numbers include fixed costs and variable costs like like what is that number though where’s that solar based on
1:01:38
reaction increase in decreasing seating yeah that’s just the reaction to seed so
1:01:44
those numbers of nonprofit on the charts are just your profit breaker from this
1:01:49
heating operation alone and these numbers that we’re seeing there are just the increase in profit or decrease in
1:01:57
profit with the seed cost and the cost of the prescription taken off so all
1:02:03
other costs in the operation fertilizer chemical land rent all those other fixed costs are not added in the calculation
1:02:10
simply because there’s I mean that would be next to impossible there’s too much information to get and every field and
1:02:17
every operation is so drastically different as hard so this is just taking into consideration the price of the seed
1:02:24
the cost of the prescription and the net impact that prescription has on on that
1:02:32
seeding operation and then and then landing right ends of profitability this
1:02:40
next question is lower seeding rates may be profitable in a year but can you
1:02:46
balance does that balance out with the good agronomy is it what what is lower seeding rate overcome by around me and
1:02:52
this this questionnaire is specifically thinking about does a lower seeding rate
1:02:58
effect weed competition and maturity like what’s your thoughts on that interaction sure absolutely and I think
1:03:05
good agronomy is key to this whole process I mean without good agronomy no no this
1:03:11
works you know we want to change seeding rate based on the economic practices we know
1:03:16
on the firm we want to make sure you know what we do on a sandy firm seating
1:03:22
wise is very different than we do on a clay firm so why are we not treating a
1:03:27
field specific it’s specifically based on those same soil types the sandy area
1:03:33
is on the firm yet seeding rate and the clay area is on a firm yet seeding rate
1:03:38
B so the tree I thought processed sand and the goal is to identify the zones
1:03:45
properly so we are managing those soil types accordingly and we are applying
1:03:51
that good agronomy to each of those zones properly so that we get the best result and we know when we are
1:03:57
economically correct we are usually most economically correct to not every time but you know I would
1:04:04
say 99% of the time in most cases when we start looking at weed pressures and
1:04:09
things like that you know usually it’s it’s a non-issue we mean we’re not cutting seed back enough that’s gonna
1:04:16
affect you know sunlight and you know the shading of the ground and competition if anything you know I think
1:04:24
we probably get an increased benefit in weed control and shading of the ground
1:04:30
by you know increasing and getting canopy closure earlier on those tougher
1:04:35
areas and I know you know preserve moisture and some of those other good benefits that happen so we try to adjust
1:04:42
our seeding rates accordingly based on the agronomy the we know I wanna farm and ultimately based on what these
1:04:50
curves are telling us and when what the results show us over time excellent and
1:04:57
and to close out our questions and we did a little bit long but as we see
1:05:03
probably three-quarters the people are still engaged so Mike you’re given market colors given good responses this
1:05:09
last question may be a philosophical question I’m not sure but I’m assuming they don’t mean threw money at it so if
1:05:15
you have good ground that has a tendency to drown out and I mean about you know
1:05:20
throw money at it all right put in put in some tiles and I’m assuming they’re not saying let’s not go that way
1:05:25
those areas are typically red and your you’ll monitor because they drown out but they’re actually really
1:05:31
good ground so what’s your recommendation for set in the seating right there great ground that drowns out
1:05:37
on a higher-than-average sure so I mean that starts to become more of a customer
1:05:45
specific and zone specific goal in something you know when we start looking at that normalized yield map those start
1:05:53
to become our unstable areas you know those those areas of unstable yield where the yield like a bugger on and on
1:05:59
a great year and they drowned out or on a wet year or they burn off and dry up
1:06:05
completely on a drought year thinking of an old type situation you know those unstable zones become very challenging
1:06:12
to write scripts for not impossible and and and not I mean it’s definitely
1:06:18
something we need to manage but understanding that instability of those
1:06:23
zones and why it occurs really starts to drive you know the success of your
1:06:29
scripts and how you make them profitable so a very good point you know I would
1:06:35
start to ask questions of the customer and find out what their comfort level is in those zones and maybe just specify
1:06:42
those those certain areas that drowned out differently you know ultimately it
1:06:48
is the best yielding area on the firm and if we don’t get that’s a situation where it drowns out you’re gonna want
1:06:54
your seeding rate to get the best bang for your dollar on the flip side when it does drowned out I want the seed there
1:06:59
because it’s just an added expense so maybe in those unstable areas or there is it you know her like that you just
1:07:06
move back to that average seeding rate or that or that middle zone so that you’re not putting yourself at risk you
1:07:14
know in both directions it’s the best bang for your dollar there’s enough seed
1:07:19
there to give you a decent yield when when you get it and you’re not breaking the bank with the ton of seed on the
1:07:26
years of floods out so you know different areas of the field and those are things where the one-on-one approach
1:07:31
and
1:07:42
yeah great appreciate the response there Mike I would like to we have been able to get
1:07:48
through all the questions and and we greatly appreciate everybody who who type in your questions and asked I’d
1:07:55
like to think Mike and Carla for leading us through this webinar today and most
1:08:00
definitely would like to thank all of the attendees who joined us you are why
1:08:07
we’re here and our whole goal for these webinars is to to help increase adoption rate uh precision AG tools and
1:08:13
technology and start to understand how to use data to get a positive ROI I mean that was the crux of this webinar today
1:08:20
was how to get a positive ROI for your planning script so again we appreciate
1:08:26
everybody joining us we will be sending out a recording of this webinar to
1:08:31
everybody who joined and you feel free to share that with your your peers or whatever if you think this is valuable
1:08:37
and if you’d like to have more webinars like this I mean we are all about
1:08:43
increasing the adoption rate of precision AG tools then please email us and tell us what your what your
1:08:49
preferred topic may be and if it’s something we can do we will absolutely queue that up for a webinar we again
1:08:58
appreciate it and with that we’re gonna in the webinar and look forward to kissing everybody the next time