Video Transcript
0:00
we think we got our audio sorted out folks Scott has handed the presentation
0:06
over to myself it’s Aaron Breimer here speaking he was just giving us that giving everyone an introduction to the
0:13
company devran has two main focuses one is around data collection so that’s the
0:20
soil sampling imagery collection utilizing drones and then the other half
0:25
of our business is heavy on data insights and that is the group that that
0:31
I manage and work with so today’s presentation is going to be around some
0:36
of those data insights that we have created over the last couple years so god had posted the poll questions we
0:45
like to share some of the poll questions just for everyone to have an idea who’s all involved so at this point it looks
0:52
like the vast majority of you heard about this webinar through the email
0:57
campaign five percent of our folks today
1:03
are growers farmers 36 percent are independent agronomists 26 percent are
1:10
in the AG retail space and 38 percent are from the AG tech world and the
1:21
question with regards to what is your current level of experience with variable rate nitrogen 33% of you have
1:28
indicated none 28% have experimented with some with it somewhat 18% are
1:34
occasional users and 21% have identified themselves as extensive users or that
1:42
you have extensive experience with it so this should be a fun group to share with
1:47
what interests you most about variable rate nitrogen 26% so just over a quarter
1:53
or indicate it’s all about higher crop yields or that’s the most interesting
1:58
about 38 percent forty percent now is around reducing costs and 33 percent is
2:06
around the improving the environment
2:13
– footprint see question number five and for those of you waiting for my
2:19
presentation to pop back up just as soon as I get the polls then we will present
2:25
my screen what is your limiting ability to utilize
2:30
variable rate nitrogen so multiple choice here about a quarter is that they
2:36
don’t have that you don’t have the required equipment about a third is confidence on the return on investment
2:43
that’s gonna be a lot of fun to share with you guys today some of the data that we’ve been analyzed and over the
2:48
last five to six years about seven percent I it’s a time piece tell me
2:56
about it we all get super busy so maybe we can find ways to make your life a little bit easier but a quarter is a
3:03
knowledge piece and and another quarter
3:08
is around just needing more customers to participate and our final question what
3:15
is your preferred data layer for setting your nitrogen rate and zones about 20%
3:22
is experienced 30% is imagery 37% is
3:27
previous yield maps 30% is pre-established management zones and it
3:34
looks like we got a couple people that are wondering what we’re talking about with data layers so hopefully we get a
3:41
chance to present that and now I’m going to flip over to you guys being able to
3:48
see my screen
4:00
all right so uh everybody able to see my
4:06
screen it is the five pillars of success so all good webinars have a little bit of a sales pitch so we’ll get this out
4:13
of the way superfast and get into the meat and potatoes of the presentation so
4:19
the five pillars that we look at when we’re talking about all things precision egg the first my screens gonna work is
4:31
all-around simplicity if it’s not easy people are not going to use it I grew up
4:39
on a farm my parents are still actively cash crop farming and dad is let’s say
4:46
bad seventy-three years old now he does very very planting very bright nitrogen auto steer and collect steel beta if we
4:53
didn’t make it easy for him he would not be doing it so its simplicity is very
4:59
important those of you who indicated a time crunch we all know that if things are not working the way they need to be
5:04
when you start you’re gonna turn it off next one I truly truly believe that
5:12
every farm is unique not only is every firm unique every field is unique and for those of you who indicated it’s all
5:18
about management zones I would agree even within the field different things are going to be different so
5:25
understanding that the uniqueness is a critical piece Devron we’re all about
5:34
innovating we’re constantly asking for feedback we want to know what challenges you’re facing we want to understand what
5:41
your objections are to what’s being brought to the market so that way we can find improvements and solutions for you
5:48
we are not interested in sin still one of the really cool things about our webinar series is that we like to share
5:55
what we’re working on so everybody else can have an idea of what what it looks like and give us that feedback so we can
6:02
keep moving we don’t have all the solutions but we have a strong desire to
6:07
find the solutions here’s a big piece were talking about the return on
6:14
investment and feeling confident when it comes to variable rate to nitrogen we talk about validation did it actually do
6:21
what it was supposed to do and this can be a challenge especially when every field is different every firm is
6:26
different time is a challenge what is a system to be able to validate and
6:33
understand what is return on investment and then the final one is around this
6:40
piece called inclusive some people call it a collaborative relationship farmers
6:46
have a huge network of people that they can rely on okay they have their egg
6:51
retailers they have their seed partners they have their equipment dealers there’s extension folks and for us
6:58
inclusive that collaboration is how do we all truly work together that is
7:04
easier said than done everyone likes to talk about collaboration it has been our
7:09
experience that is a challenge requires a lot of trust and it requires a
7:15
confidence to be able to work together we’ve got an offer at the end of the presentation around how we are going to
7:22
get give you guys a chance to test us out on that collaboration so something
7:27
to look forward to all right presentation overview that’s the sales stuff let’s get into the good stuff as I
7:34
mentioned I grew up on a farm I’ve got my bachelor science agriculture degree and let’s see ten years in a grete ale
7:43
followed by nine years into precision AG consulting space and as I mentioned I
7:50
now am the general manager of our data insights group the data insights group we run under the brand called Veritas so
7:57
when you see that on the screen that is it’s the connection so Devron is the company Veritas is the data insights
8:04
group within there we’re going to talk briefly around the nitrogen overview
8:09
some of the opportunities some of the challenges you’d have spend a nice bit of time
8:15
around the promises and technology this presentation is around the facts and fables of variable right nitrogen and
8:24
a lot of the facts and fables are going to live in their promises and technology and technology that we see definitely
8:32
going to go over a bunch of testing and results that we’ve had and how we
8:37
execute that so that way folks are able to get a good input and then finally
8:43
we’re going to summarize the presentation so any good stuff all right nitrogen I call it the sexy
8:51
nutrient and here’s why 57% of all fertilizers are applied this
8:57
was the most recent numbers that I can get indicated at 57% of all fertilizer
9:02
applied in North America was nitrogen based fertilizers you can see 20% is
9:09
phosphorus and 23% is potassium for those of you who promote micronutrients
9:16
looks like those numbers didn’t get lumped in so it’s these big three that are involved let’s face it nitrogen for
9:25
the most part has an annual shelf life and when we mean by the annual shelf
9:31
life is that it’s something that we have to address every year it’s not an in most crops in corn and wheat cotton in
9:39
canola a little bit different when we get into soybeans but it does have that annual shelf life that we have to
9:45
address it year in year out it’s not that you can put extra fertilizer down and that’s going to be around for a
9:52
longer period of time it is almost always one of the top three costs that a farmer has to deal with the deficiency
10:00
is visible this is a nitrogen response trial you don’t have to be a very good
10:07
agronomist to be able to pick out where the nitrogen deficiency is and in fact in my experience I have yet to meet a
10:14
farmer who was honest with me that has never done an accidental
10:19
nitrogen trial at some point whether they skipped one pass whether they ran out as soon whether it was that weird
10:26
corner that they couldn’t get into whatever the reason was at some point a farmer has done an accident to let
10:33
nitrogen trial and we all know that nitrogen pays so there is a and reside pile of
10:40
research every land-grant university that I’m aware of has done extensive research on that nitrogen because it’s
10:47
one of those questions that keeps coming up because let’s face it as I said nitrogen is sexy another piece there is
10:56
huge field variability whether it’s soil type whether it’s management and we’ll get into some of this further into the
11:03
presentation field variability has a huge impact around nitrogen when we talk
11:08
about the validation where I get into a little bit more of this and then the
11:14
other one in this assay showed up in the pool this was a significant concern is around the environmental impact of
11:21
nitrogen fertilizer the University
11:27
professor of mine describes nitrogen as a leaky system so all good certified
11:32
crop advisors and agronomists are very familiar with the nitrogen cycle so I’m
11:37
not going to go over the nitrogen cycle while I am going to talk about our two
11:42
sets of variables and the first set is what we call these controllable variables so this to me your crop type
11:48
if you are growing soybeans you do not need to worry about nitrogen or not very
11:56
much if you’re growing corn or wheat or canola or cotton then you do have to
12:03
worry about it and you do have to be able to manage it corn requires a lot more nitrogen than
12:09
wheat for example the other piece in there our control is the fertilizer
12:14
application so this is comes back to the forest the right time the right plays the right rate and the right source so
12:20
that is something that we are able to control as agronomy or as the agriculture professionals and then the
12:28
final one that I mentioned here is a control of controllable variable as a little bit of a segue to the uncontrollable is irrigation if you have
12:35
the ability to irrigate you can control that to a certain extent most irrigation
12:42
schemes that I have seen there is often some restrictions as to how much can be
12:47
irrigated when it can be rated and pieces like that so it’s not completely control and that’s face there’s a lot of corn
12:54
production on a lot of wheat production that does not have irrigation so hence
13:00
the asterisks on that line and the uncontrollable variables like I said that irrigation is a Segway because
13:05
weather weather is a huge part of nitrogen and making it a leaky system
13:12
the rainfall the patterns of rainfall when it’s coming down temperatures that
13:17
involve a pile of different pieces in there and then the other part is soil
13:24
properties some people could argue that you might be able to modify the chemical properties slightly but that is going to
13:31
be pretty expensive in my experience but then the physical and biological once
13:36
again maybe you can modify it or influence it but you cannot completely
13:42
control it in my experience so if you’re into the whole leaky pipe if you’re not
13:48
a big fan of the nitrogen cycle there it is exactly so you had your nitrogen
13:53
disappearing from different sources if it was a straight full pipe if this air
13:58
buried nitrogen would be easy unfortunately that is not the case technology overview all right here’s a
14:05
good stuff everybody seems to love to talk about imagery indexes this could be
14:11
NDB I something called G NDVI you might hear about red edge I’m going to get
14:18
into the big Sciences behind it here’s what it is it’s using wavelengths reflectance from the plant and it’s
14:25
creating that these different indexes these different ratios if you will so the NDVI which is probably the standard
14:32
for most most of agriculture is taking the near-infrared subtracting the red
14:39
band and then dividing the whole thing by the near-infrared band plus the red
14:45
band and here’s why the majority of plants not all but the majority of plants this is what the
14:53
photosynthesis absorption is so this is how the plant gets its the energy z2 blue light or red light and so when you
15:00
get into a lot of these indexes they’re looking at either that red light or they’re looking
15:06
to a lesser extent that that green light and what’s going on here is so
15:12
near-infrared is to the right of that red curve where it’s disappearing so what the what we’re trying to analyze is
15:20
what is the ratio that the plant is absorbing of that red light so that is
15:26
what a lot of these indexes are doing and a lot of it’s done by what we call multi spectral sensors for some reason
15:33
in the industry we like to use fancy words this is basically a specialized camera that can capture different
15:39
wavelengths of of light that’s literally what we’re talking about when we’re talking sensors it is a
15:46
camera here is the major part that makes NDVI work or not work and that is the
15:55
assumption that nitrogen is your limiting factor it is not always your
16:01
limiting factor and that is the challenge behind this there is a concept
16:07
called hyper spectral imagery and basically to a multispectral camera you might have three four maybe five
16:15
different bands of light and then you can look at that different combinations hyperspectral is this mass of data set
16:23
I’ve seen sensors cameras that can capture up to 256 different segments and
16:30
then you’re getting into all kinds of combinations you’re talking massive statistical analysis on this not saying
16:37
that it will ever have a fit for us but at this point hyperspectral is the realm of the
16:44
researchers like I said sensors that’s it this is your cameras so this can be
16:51
the handheld I’ve seen different handheld ones that you can take a NDVI
16:56
reading you can definitely set up sensors on the drones and a lot of
17:02
people are starting to have crop health maps or NDVI maps from satellite imagery
17:11
just like sensors as cameras everyone likes to talk about algorithms
17:16
algorithms all it is a simple equation well maybe not simple but it’s an equation it would be so much
17:24
easier if we just told and users that’s what it is it’s that your NDVI is this score the equation says you need to put
17:31
this much nitrogen down the challenge with algorithms is they require constant
17:36
ground-truthing testing or a precise dressed nitrate test or a pre-plant
17:43
nitrate test or a post harder stock nitrate test so you need to be taking
17:49
all those different testing to make sure that your algorithm is accurate unless unless you are going to go to the
17:56
assumption that one algorithm is going to work for every farm for every field
18:01
for every management zone I believe that every farm field management zone is
18:08
unique so having one algorithm that’s going to work for everything is a little bit of a challenge from my way of
18:14
thinking and we bet on some of the examples that I will show in my opinion
18:20
if you are going to do variable rate nitrogen you absolutely must be testing
18:25
if you’re not testing you’re setting yourself up to not be able to take full
18:31
advantage of it next piece that I want to talk about is this concept of
18:37
buffering of the soil of nitrogen so it’s literally the ability of the soil
18:42
to provide a stable source of nitrogen available for root uptake so it could be
18:47
soil type so here we have two different soil types and you can see depending on the year where the optimum nitrogen rate
18:55
is two very different soil types and you can see that the curves are different so
19:01
you once again taking into consideration what’s going on with that that soil in
19:07
my opinion it’s influenced by organic matter soil type and a big big piece is management practices talk about soil
19:15
water supply as well but if you look at management so if buffering capacity is
19:21
nutrients into the roots the nutrients can be available but if you mud your corn in you know what I mean by muddy in
19:26
your corn and you got on there just a little bit early or on the heavier part of your firm
19:32
Headlands and caused us and compaction of the roots can’t get out you’re going to have a challenge I’ve got another
19:38
data set this is from a long-term study this is actually 10 years of different
19:44
optimum nitrogen rates exact same site so your soil types of soil all stayed
19:49
the same but weather is that influence ahead so this is this becomes the challenge is trying to figure this part
19:55
out from that study there is a strong
20:01
belief that soil water has started to play a big part so if you go back to why
20:07
Biggs law of the minimum we were talking about soil conditions and other growth factors like the management but then
20:13
you’ve got this this water and nitrogen and how they are influencing each other
20:18
so from that 10-year study rainfall from
20:24
v5 to v12 is showing a very strong correlation to what’s called the maximum
20:32
economic return of the nitrogen so depending on which paper you might want to use optimum nitrogen response rate
20:40
there’s different terminology basically it’s what is the ideal and you can see there’s fairly strong correlation to
20:46
that based on the rainfall each one of those data points is a different burn based on the different year so in every
20:54
case this was the same variety you can see the burn which is the maximum
21:01
economic return of the nitrogen has very little correlation so the closer to 1
21:07
the higher your correlation is so for planting to the v4 very little to no
21:14
correlation you can see in that v5 to be 12 and if you’re wondering one AME why
21:20
is that is the yield that is achieved when you hit the Merc that the maximum
21:25
economic return but very little before that b-52 v12 and then very little after
21:31
that VP that v12 Sueno into that VT and r1 or even later so this is assuming
21:39
about one or two passes of nitrogen here’s the thinking behind
21:45
why this is actually something from Ross bender who is it works for mosaic and he
21:52
is segmenting note where the nitrogen is heading in the plant and you can see right around the v10 stage the corn
22:00
plant just goes absolutely wild for nitrogen stocks up as much as it is a can and so up to that stage we’re trying
22:09
to get if guess is not the right word we’ll try to accurately predict and
22:15
accurately is it in air quotes in this case around what is your ideal nitrogen
22:21
so I’ve indicated that anything past v10 nitrogen becomes critical we are
22:28
attempting to match the side dressing with the potential yield now nitrogen
22:36
moves through mass flow so it requires water so if you don’t have water try to
22:42
get it into the roots as a challenge so waiting to v10 is great because you’re
22:47
gonna have a better idea am I dealing with a 250 bushel corn crop or am i dealing with a hundred and fifty bushel
22:53
corn crop the challenge is is view wait to v10 and you don’t get any rain and you’ve got that nitrogen sitting on the
22:59
surface trying to get it into the roots is next to impossible if you go and you
23:04
put your nitrogen on at b5 you have a better chance of getting that rain to get the moisture get the nitrogen down
23:10
into the roots however you don’t have as much of a window as to the optimum time
23:16
to get nitrogen and I write down one of the things that we see in the industry
23:21
is this concept of wide rot I mentioned my drop there’s a bunch of different systems on on the market
23:27
basically it’s draw piping and nitrogen down into the canopy and the idea being
23:34
that the limited rainfall from the corn plant acts as a funnel and gets the
23:41
nitrogen down right around the the base of the plant the challenge with this is
23:49
most application systems are go putting this on at the six seven miles per hour
23:56
I challenge out any of you to put a proCamera on one of these machines at
24:02
600 miles an hour and watch how those hoses are whipping around they are not
24:08
able to place that nitrogen right by the rope consistently it is going back and forth all over so you need that
24:14
consistent ring this is a study coming out of Aaron Stefano’s who was with an
24:22
egg reliant seed brand he is now with mosaic as well and what he did was he planted three different varieties and he
24:29
did four different nitrogen programs he did no late-season nitrogen he put
24:36
nitrogen down just at the v8 stage he put nitrogen down just at the v12 stage
24:41
and then he did a combination so that is your six tiers are you fixed varieties
24:47
you can see the that really no response difference between v8 and the
24:53
combination waiting too late definitely had an impact this is what we call the
24:59
fixed around so our flex around so this is the corn varieties that can alter the
25:06
number of kernel rows and then the final one is the fixed long and these are
25:12
varieties that are adjust the length of a year based on moisture rainfall
25:19
nutrients pieces like that it’s a great study bid to be able to understand how different hybrids are interacting with
25:25
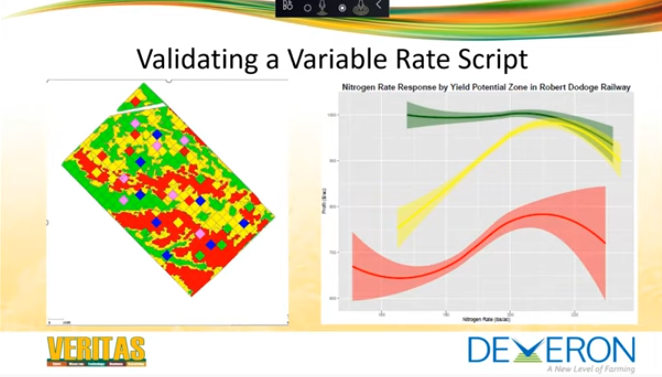
it once again showing that you have to take all these variables into consideration all right now we’re gonna
25:33
get into how we validate a script this is something that I find very interesting but I’m a little bit of a
25:39
math guy so I’ll do my best to explain how this works what we can do is we create a management zone and then we
25:46
insert randomized check blocks all over it so we can have all kinds of very
25:51
different rates so literally every one of our scripts that we send out the door we turn into a complete randomized block
25:59
design so those of you or statisticians will understand where I’m coming from with that we set it up so it’s super
26:05
simple that nothing extra Hospital you don’t have to be leaving check strips the check blocks are doing all the work
26:11
for you you run the script it said taken care of now when we do the
26:18
analysis we are not using the targa rates which is what these what the
26:24
script is running what we are actually take is we take the actual as applied data so that allows us to have a
26:31
continuous flow of different data points and we split those blocks up so we’re
26:37
getting a lot of data and we use a regression system and we split it out as
26:44
you can see in two different management zones this was one of I thought I had nitrogen figured out about five six
26:50
years ago I wanted to put more nitrogen down where the corn was gonna yield three hundred bushels per acre so that’s
26:57
what I thought I needed to do and that’s what I attempted to do and boy was I wrong what we found was that the best
27:05
response to additional nitrogen was the median productivity and the low productivity zone the high productivity
27:11
zone actually did not need excess nitrogen and one of the thinking’s
27:16
behind why that is the case is because if you think about in a lot of cases
27:23
that high productivity zone has a lot of extra nitrogen around because of organic
27:30
matter I’ll show you what I mean so nitrogen from organic matter if you take a furrow slice which is the top six
27:37
inches of soil works out to on average two million pounds yes I realize
27:43
different fields are gonna be different but on average bear with me two million pounds in the top six inches of an acre
27:50
so if you took it all off and you waited that’s how you come up with that number for every one percent that is organic
27:58
matter from your soil test that is it means twenty thousand pounds in that six
28:04
inches is as organic matter now if you assume 15 percent of organic matter is
28:11
nitrogen and I have seen numbers from 12 and a half to 17 and a half from the research so I used 15% if you want to
28:18
argue one way or the other by all means the concept is stays the same at 15% of
28:24
organic matter so for every 1% of organic matter you have 3000 pounds of nitrogen
28:30
so if for example if you had 3000 or 3%
28:35
organic matter you actually have 9,000 pounds of nitrogen locked up as organic matter going back to the research papers
28:43
once again between two and two and a half percent of all organic matter is
28:48
marelize on any given year yes I recognize that some papers are gonna say
28:53
it’s one percent and I also have papers I will tell me four percent I will tell you it changes depending on the year it
29:00
depends on the soil type once again this is why we’re doing psn t-test preside restraint retest replant nitrate test
29:07
because we’re constantly evolving it but if you were to take that two and two two
29:14
and a half percent and if you had a soil test that had only one and a half percent organic matter i recognize for
29:21
some of you that are on sharp sands that might be a dream to be at that point but at that point you would be looking at
29:27
between 90 and 110 pounds per acre of nitrogen is mineralized that’s assuming
29:35
that the roots can get to it management zones stuff like that management practices all come into
29:40
consideration if you had doubled it so three percent organic matters some of
29:45
you clay guys so it will be able to relate to that so it can be up to 220
29:51
pounds per acre that is marelize on any given year that’s mean it’s going to happen every year and the other piece
29:57
that I want to stress is nitrogen mineralization is a very very dynamic process please do
30:06
not go away from this webinar thinking that if you have three percent organic matter that you don’t have to put any
30:13
nitrogen down that is not what they were saying at all what we’re saying is that
30:18
there’s a lot of nitrogen available there and all depends if it’s actually
30:24
getting into the roots I’m going to use an example this is actually from my father’s firm a couple years ago and are
30:33
based on the experience that I had before the lower productivity zones so
30:39
the red I put more nitrogen down and you can see
30:45
there was a little better response but it dropped off pretty quick the second
30:51
lowest productivity zone that yellow line I’ll shows a continuing declining
30:57
curve not exactly what I was expecting it’s actually and if you look at the
31:03
green and and definitely the blue in the case of the blue curve that’s the best
31:08
ground and I wasn’t getting out of nitrogen on there so my father was not
31:13
super thrilled to see the city’s results and this is why comes back being important to be constantly testing to
31:20
understand if it makes sense with what your rates are going to be now one of
31:29
the things with my father that he absolutely loves to do and those of you were paying attention my dad loves to do
31:36
work with cover crops and I’m not gonna get into cover crops a whole lot we’re gonna have another webinar around cover crops in the near future but is to
31:44
understand the carbon to nitrogen ratio what we have found is that if you had
31:49
are going doing corn on corn or oats and cereal rye as cover crops why would you
31:56
actually end up having to do is you have to invert the the thinking that we had
32:01
originally and that is the corn on corn you’re gonna have a lot of residue on
32:07
the best part of your ground and that extra carbon is going to soak up that extra nitrogen that is being mineralized
32:13
like I said it’s very complicated situation same with oats and cereal right you’ve got to be able to manage
32:19
that same with manure application it’s basically an uncontrolled slow release
32:26
fast release depending on the year release and understanding if are you incorporating it are you experiencing
32:33
compaction how are the roots interacting with that nitrogen tissue testing soil
32:39
testing to understand what’s available in order to be able to make the best recommendations I’m sorry but I really
32:46
disagree with the idea that one algorithm is going to solve all this it can make significant money but you have
32:54
to be thinking about okay what actually makes sense management zones great great idea
33:00
but think about what you actually want to do we’re going on with that management zone another part in cover
33:07
crops is legumes this is a winter wheat field very common in some parts of the
33:12
world to spread red clover seed in the spring and then after the wheat the
33:18
clover grows up and then the fall they terminated and thinking that there’s nitrogen credit you don’t have to be a
33:25
rocket scientist to figure out that there’s huge variability there we’re actually doing a fairly significant
33:31
study we have 21 sites this year where we are actually counting clover plants
33:37
find the fields for NDVI to try to measure the clover and then taking it to
33:43
the following year and doing variable rate nitrogen on there too let’s see what the Maitre D’ responses once we
33:49
have that data will be happy to publish and share with all of you now
33:55
interesting thing that we have already found on that because this was actually started last year so this is our first
34:01
year we’re doing the actual nitrogen is the number of plants that tends to
34:07
correlate very nicely to the clover the
34:13
coverage that we see in the field however the clover coverage tends to
34:20
correlate very nice to the NDVI the conclusion you’d like to draw is that plant counts should correlate NDVI and
34:28
it does not so a big part of this study for us is going to be is it plant counts
34:34
that’s important is it clover stand like clover coverage or is it the health of
34:39
the clover that NDVI that is correlating with India with nitrate levels and then
34:47
also into the yield results so variability huge piece almost done
34:55
something else that we’ve been working with is this concept of green snap so
35:00
we’re able to use a droney imagery to be able to identify and quantify how much
35:07
stop is happening me in a field so this is a you can see the bare ground image
35:12
on my left as well as a imagery index
35:17
all of those tiny little black specks that’s where green snap is happening now
35:23
have you started looking back and forth between those two pictures you’ll see a
35:29
lot of that green snap tends to be coming from that darker a soil type especially down here and the bottom left
35:36
corner there was a lot of green stop there in a lot of cases because of that
35:43
extra nitrogen and here’s what’s going on some of you might be familiar with Mulder’s chart nitrogen has a
35:51
antagonistic approach or impact on both boron and potassium and both boron
35:59
potassium are important in cell wall strength so having extra nitrogen around
36:04
so pumping the extra nitrogen down either pre-planned or a side dress and then also having all
36:12
that extra nitrogen coming being released from that organic matter is leading it to both boron and potassium
36:21
being antagonized and end result is we are seeing more cases of green snap from
36:26
excess nitrogen so it’s another part of that puzzle that we’re looking at crop
36:33
health maps this is actually a weak image so this is what we call red green
36:39
blue this is what you see with your naked eye this was taken last fall this
36:44
was a crop health map coming out of a satellite this spring and as you can see
36:49
there’s an area towards the left that the crop health is not very good and it
36:55
doesn’t seem to correlate very well with that first image so the question is is what’s going on there well based on our
37:02
experience where the crop is not as healthy we need to be putting more nitrogen on that has been our experience
37:08
so that’s what I would would Burnley recommend however talking to the grower
37:14
that area that does not have good crop health it’s not that it doesn’t have
37:21
good crop health the crop is dead what happened is it’s winter kill there was
37:26
snow that melted and then ice and it just killed the wheat so putting extra
37:32
nitrogen on there extra nitrogen is not going to bring back a dead crop so what we actually did was we created a more or
37:38
less an on off script that would turn his sprayer off as he was going across those dead areas so once again just
37:46
assuming crop health and that’s how you’re going to do it probably not ideal
37:52
all right summary very nitrogen has a lot of moving parts I think everybody
37:58
has heard that there is definitely no magic solution there’s huge parts around
38:06
the economics and weather the longer that we can hold off on applying nitrogen and still ensure that the
38:13
nitrogen is going to get down into the roots the better the economic certainty of our recommendations definitely can
38:22
use imagery I love using management zones whether they’re based off historical yield data whether they’re
38:29
based off of imagery absolutely I love it but you need to be looking back at
38:35
what’s going on with the productivity zones here’s an example I think this was
38:41
actually included in the invitation to this webinar I feel that I’ve been working with this is actually on
38:48
management zones based off of three or four years historical yield data now
38:54
it’s three or four years of historical yield data but these management zones
38:59
have been pretty static and on any one year of yield data I can probably come up with something very close to this so
39:06
it’s not a case that you need to wait three or four years just like with that wheat example you can go in there with
39:11
airborne nitrogen in there with just one year of imagery past tests and more
39:19
testing yes you can put in track strips yes you can put in check blocks but you need to be able to analyze that data
39:26
afterwards we are all busy if you’re not comfortable analyzing the data or if you
39:32
want some help we would be to talk to you we do not have to write the scripts if you want to write your
39:38
own scripts and ship them over to us we will be happy to put our validation and a system on there and work with you to
39:44
be able to validate it we don’t have to put our name on on any of your material we’re here to support you so call to
39:52
action on that huge economic opportunities for both the farmers and the industry on this piece let’s face it
40:00
farmers love to say I’m spend money if you add a little extra money to a farmers bottom line they will spend it
40:08
environmental sustainability hey that’s for all of us we need to be doing a better job around nitrogen and here’s
40:16
the thank you for everyone reach out to Devron I think everybody would have
40:21
gotten an email from either Scott or Carla or Josh my colleagues and they
40:27
would be happy to have a chat with you around giving you that validated script
40:36
after this presentation here you’re gonna get another email from them feel free to shoot them back a direct email
40:43
reach out to us through our website we would be happy to make sure you guys were able to take advantage of that also
40:51
if you just want to have a chat with me there’s my contact information I do exist on Twitter I have been known to
40:57
get myself in trouble once in a while on Twitter so I try to behave myself but if
41:03
you do want some entertainment once in a while I do get into trouble there as well and my email and phone number as
41:08
well would love to talk to any of you and yeah I am going to end my
41:16
presentation now and I am going to we’re gonna try to get Scott back on line and
41:23
see if his audio is a little bit better
41:34
all right Scott you hear us you there
41:42
Scott all right looks like Scott’s still having some technical difficulties let’s
41:51
take a look at what questions we’ve got first question is see CCAC use yes we
42:00
have registered for them we expect confirmation any day now the we will send out an email on how you
42:07
can get those CEUs so perfect for that
42:15
next question is around the data layers what data layers to use to create
42:20
management zones for nitrogen like I said my favorite management zone tends
42:27
to be a TB yield data now when I talk about yield data is I don’t take just
42:35
any yield data I work in an area that does have some winter wheat winter wheat loves to have
42:42
find unique ways every year to try to kill itself and so because of that taking the wheat yield data and adding
42:50
that into any algorithm it can be a little bit of a challenge if you want to use that as a historical data layer so
42:57
I’m always a little hesitant to be using wheat idea same with on soybeans soybean very great
43:06
yield data until you get a year when you get a lot of white mold for those of you
43:11
who grow soybeans on 30 inches or on heavy ground or sharps hands it might be very uncommon for you guys to see white
43:18
mold there are areas that grow soybeans on 15 inches or even 7.5 inches and in
43:25
those cases especially it’s a little Grothe or if we start getting on a nice bit of rain you can see white mold start
43:34
to build up and in those cases you can
43:39
have significant yield loss so now all of a sudden your soybean yield data is testing that your best or highest yield
43:50
potential area is actually one of your worst so once again when it comes to data later when I’m talking to
43:57
individuals around the data layer the absolute most important data layer is
44:03
the data layer between your ears it’s the experience you have on that
44:09
farm including the farmer and into the conversation is absolutely critical to
44:16
make sure that you’re taking therefore advantage of that next question is how are recommendations
44:23
made so the recommendations that I use I
44:29
will start off with a fairly limited range of nitrogen rates one of the
44:38
things that I have learned with variable rate uh nitrogen is if a farmer comes to
44:44
me and says listen I want to spend let’s
44:49
say $75 per acre on nitrogen I want to put down a hundred seventy five pounds
44:54
of nitrogen as an average can you help me put that nitrogen in the best
45:00
possible spot yeah I can probably do a fairly decent job of that I need to take
45:05
into consideration what is the the crop what is the soil type what is his
45:10
management what was last year’s crop but I can get a pretty good handle if I’ve got some good management so as to move
45:16
that nitrogen around now that same farmer comes to me and says hey I want
45:23
to maximize my yield what amount of nitrogen should I be putting down that is a very tough question to be able to
45:31
answer because it’s moving year to year the longer that I can hold off to be able to make that nitrogen
45:37
recommendation the better the more confident I’m gonna be but like I said
45:43
now you got this issue is am I going to get rainfall to get it in so for those
45:48
of you who have the ability ability to turn on the rain IE irrigation that is
45:54
going to be a huge asset but if you’re looking for a general idea what I will do is I will
46:03
split a field into either two or three zones and the lower productivity zones
46:10
last third round out always the exception Lester groundout those lower
46:15
productivity zones I usually go about twenty to twenty five pounds above whatever the average is and in the lower
46:22
or in the higher productivity zones where that higher organic matter is where it’s going to mineralize a little
46:27
bit more nitrogen I’m backing down twenty to twenty five pounds that’s where I’m going to start and then I’m
46:33
gonna be testing every year to be able to find to that a little bit further all
46:38
right next question you have a protocol for taking the psmt soil sample cores in
46:46
regards to corn crop row spacing and where the cores are taken great question
46:52
so our approach on this is that we want
46:57
to take a twelve inch that’s the soils that I’m familiar with I’m definitely
47:02
open to seeing different approaches but I’m taking a twelve inch core segment in
47:08
it into both six inches and then some two or six to twelve inches so I’ve got
47:14
a shallow and a deep nitrate test and I am doing that ideally one sample in
47:23
every management zone that I’ve got in that field that’s as a bare minimum if I
47:28
have my choice I want to be able to be taking taking two in each zone takes a
47:36
little bit more time but that is the approach that we use for for psmt timing
47:45
wise on that I try to do it about seven days prior to when the farmer is wanting
47:52
to decide dress my experience with psmt test one of the challenges is you do
47:59
have to keep those samples cold so I’ll make sure that I’ve got a cooler so next
48:09
question are you all – doing variable-rate see prescriptions
48:14
as well so putting more seeds per acre in better management zones that’s I’d changed the nitrogen rate and
48:23
that’s actually coming from me Lee I love that question I am that’s actually where I first cut my teeth on variable
48:30
rate well and that’s actually where the whole validation curves come from is from doing the work with very braid
48:41
planting or variable rate seeding it really started off with variable rate corn and then have moved in Fairburn
48:48
soybeans variable rate edible beans so yes a lot of experience on that that
48:54
actually goes back to the last ten years as a general rule of thumb you because
49:00
you’re asking does that change the nitrogen rate I’m assuming you’re talking with corn it does somewhat not
49:08
as much as you would think actually the bigger piece that comes into play is
49:13
understanding how on your seeding rate is being is being influenced by your
49:20
phosphorus and potassium levels because those phosphorus and potassium levels are going to drive a stock stock
49:27
strength one of the cool parts about how we do very berate validation is those
49:33
chat blocks you can put some pretty cool outlier rates so with the example I always like to use as my father my dad
49:41
likes to push the the envelope so I was putting able to put in these those check locks and those check box about 120 feet
49:47
by 120 feet so about a third of an acre and those check blocks came next year we
49:53
went at 40,000 and a couple of them they were completely flat now most farmers don’t appreciate when
50:02
you would cause your corn or the crop to go completely flat however in that case
50:09
my dad was really glad that he was just dealing with about 6 or 7 check blocks of flat corn instead of having a third
50:17
of his field flat so that is something that I see a lot of value in it is being
50:26
able – to push the envelopes and see how things interact and like Aaron Stefano’s
50:32
who’s with mosaic that I mentioned he’s showing that even variety yes
50:38
sensitivity is a big big part of that all right so that’s all I got all the
50:44
questions there let’s see if we got some
50:50
more questions and it sort of spot would
50:58
like to see an example of one of your prescription algorithms it’s not as private than I understand I don’t like
51:07
any of the ones that I have used in past years Roger I agree with you the best
51:14
algorithm is the one that you buy into and that you can validate like I said if
51:19
you reach out to us I would love to have a chat with you and let’s see if we can build an algorithm
51:25
that works for your farmers or if you’re a farmer for your ground and one that you can feel confident in so yeah we
51:32
will definitely make sure and to work with everyone in anyone who wants to add value to the farm operations that
51:40
they’re involved with and with that we are out of questions and I’ve got two
51:46
minutes to spare before the end of the presentation I take the time now to thank everyone for participating those
51:54
were some great questions and I do a lot of fun sharing what we’re doing on with nitrogen keep an eye on your email I
52:00
know Scott has a bunch more webinars planned and we’ve got some pretty cool
52:06
topics and more data we want to share especially with the cover crop so yeah
52:12
we’ve got really cool stuff on cover crops coming so that’s the teaser and looking forward to talking to you guys
52:18
again soon thanks